A lot has happened in the markets over the last two decades. From the Dot.com bubble of 2000, to the global financial crisis of 2008/2009, and now the devastating impact that the Coronavirus has had on the world. This very recent COVID-19-infused bear market has relegated memories of the longest bull-market in the history of equities (2009 to 2020), to the back of our minds. The fact is that the length and quantum of that bull-market staggered many market participants.
In particular, the stellar performance of technology stocks stood out. However, their relative size in equity market indices has given rise to conflicting views on their value, as equity strategists harked back to the dreaded days of the 2000 Dot.com bubble. The comparison has been made that technology companies are again trading at lofty valuations and that this will precede a market crash in equities, very similar to that of the early 2000s.
We, however, now know that the Dot.com bubble market crash had nothing to do with the valuation of technology companies. This is worthwhile considering, as we dive further into a world where technology companies are becoming more and more important for various reasons.
WERE VALUATIONS REALLY THAT HIGH?”
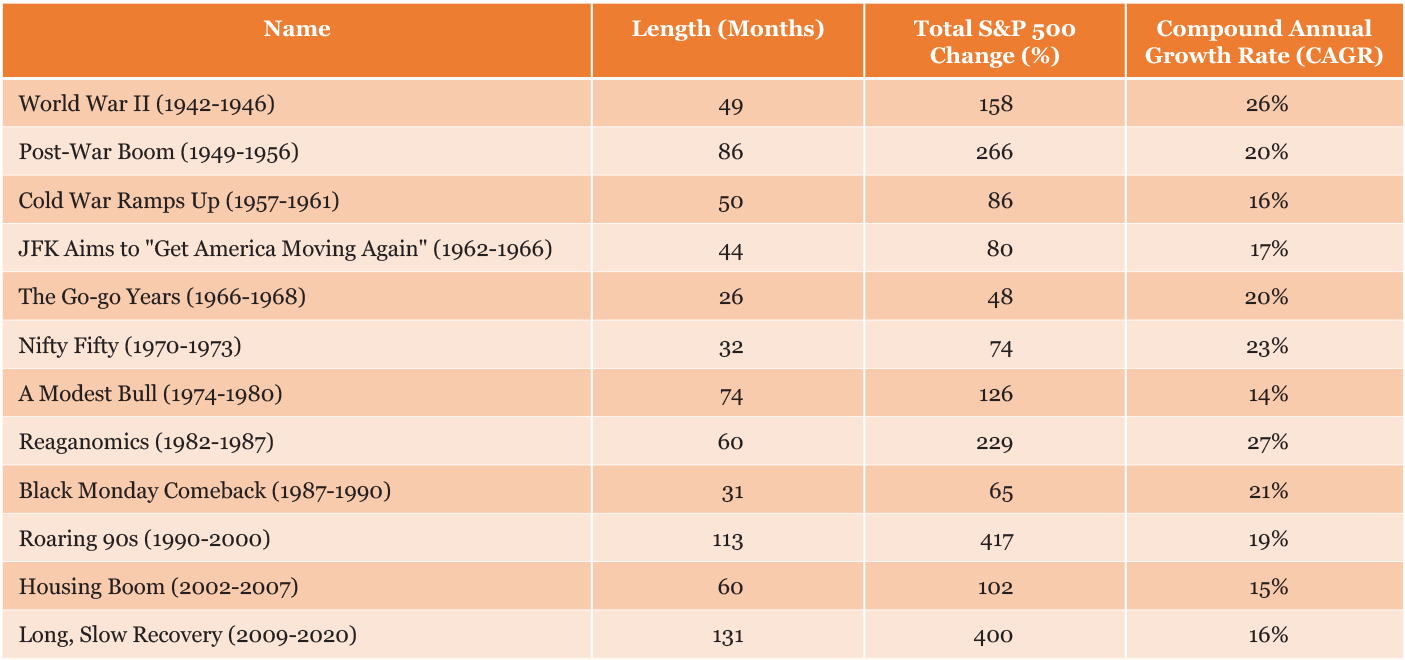
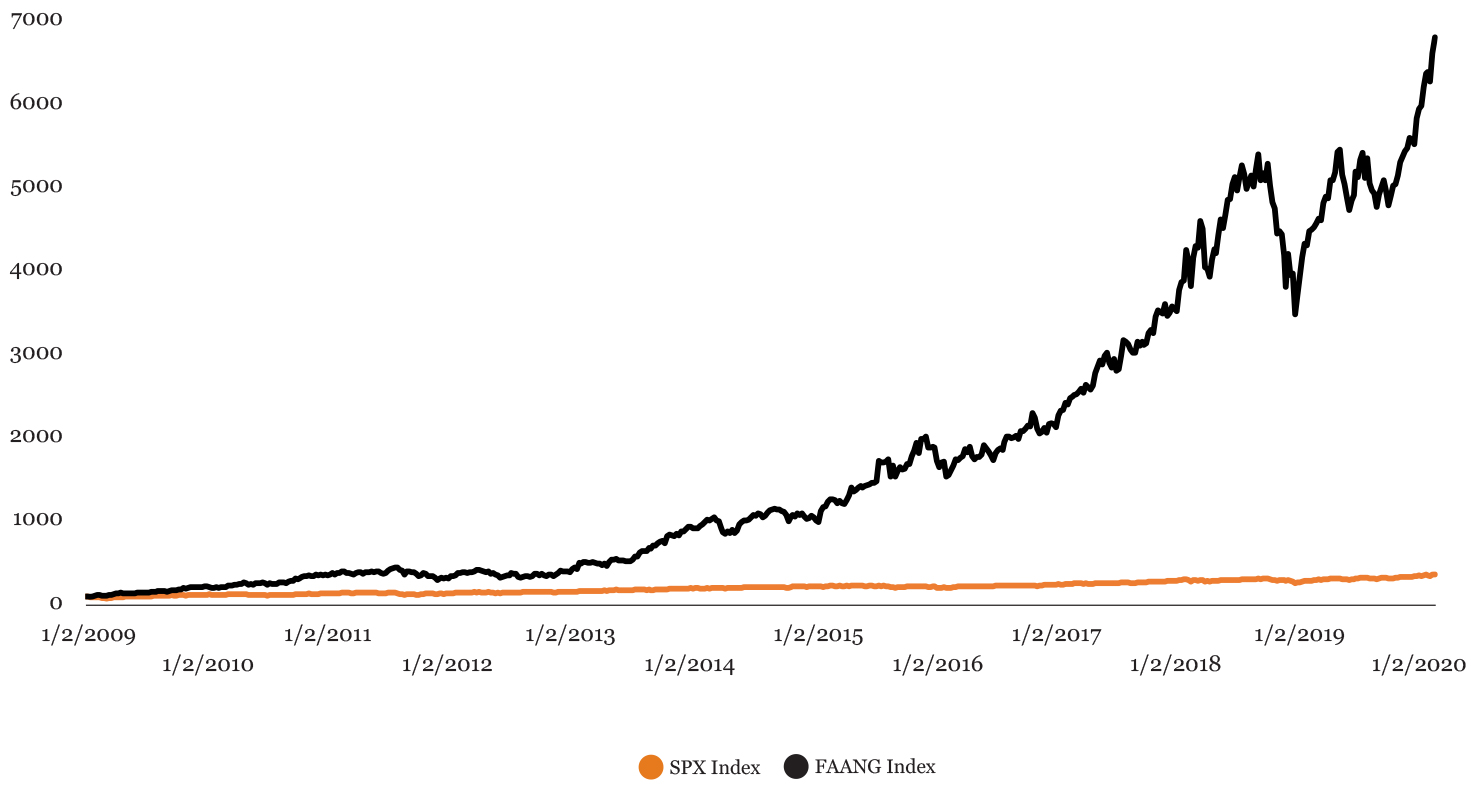
To put into context the extent of this recent bull market, as well as the rally in technology, consider the graphics below. The first table shows all the bull markets from 1940 to date, detailing their durations, their returns and their annual growth rates, while the graph juxtaposes the return in the overall market to that of select technology stocks during the last bull market.
PREVIOUS BULL MARKETS
SOURCE: VISUAL CAPITALIST
Table 1 reflects the fact that our latest bull market was not only the longest but also one of the largest in the context of absolute return rivalling the roaring 90s.
This is important, as it is crucial to not underestimate the last bull market against its peers. It also gives tremendous emphasis for graph 1, below, which plots the performance of the same S& 500 over its longest bull period versus a portfolio of the top technology stocks, Facebook, Apple, Amazon, Netflix and Google, the FAANG stocks (equally weighted).
FAANG PORTFOLIO VS. S&P 500
SOURCE: BLOOMBERG DATA, CAM CALCULATIONS
The combination of FAANG stocks vastly outperforms the S&P 500 making the index look like a paltry asset class. Yet, consider the fact that both the SPX and FAANG indices are based at 100, and the return of the S∓P 500 equates to 400%. Recall that the table above highlights how spectacular this return was in the context of previous bear markets. However, it pales in comparison to the combination of FAANG securities that returned close to 7000% over the same period.
ARE TODAY'S TECHNOLOGY COMPANIES DIFFERENT?
The question is, are technology stocks overvalued based on graph 1? Well it’s not that easy. The group of technology stocks that feature in our indices today are very different from the technology stocks that were shattered in the Dot.com bubble. Dot.com bubble companies typically listed as quickly as they could, early in the company’s life cycle. They often featured operations that barely included positive sales, let alone positive earnings or profits. The result was a combination of companies with little in the way of strong fundamentals.
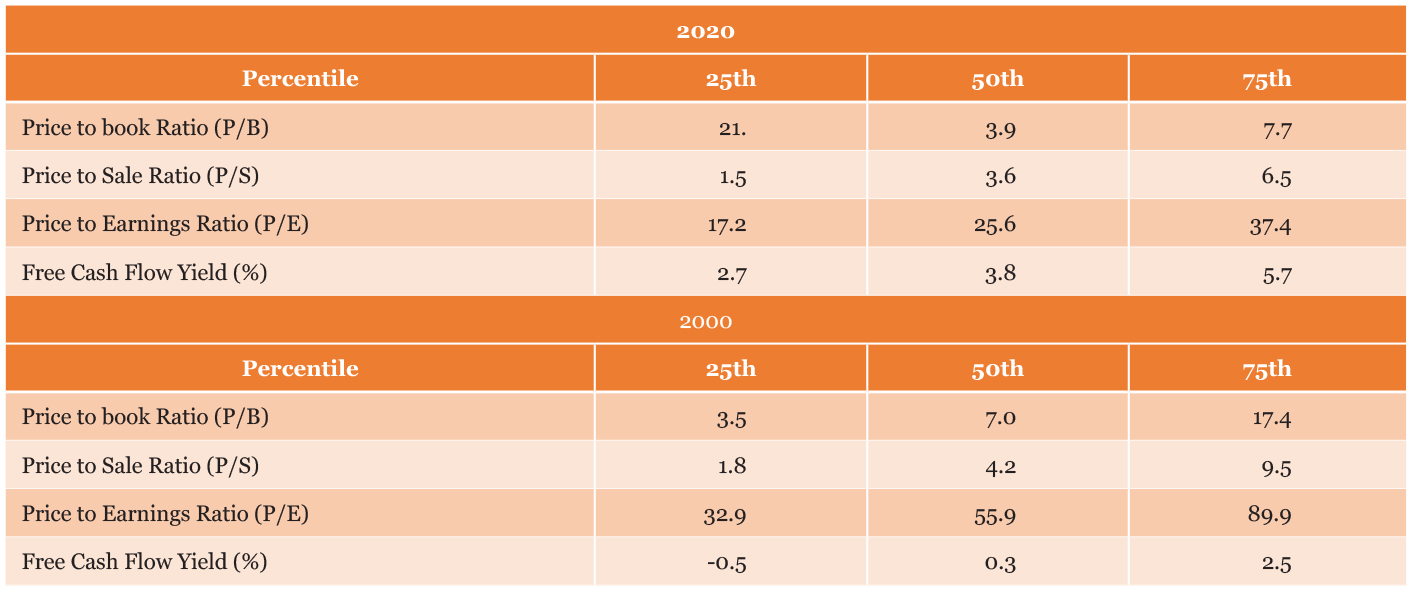
In contrast, today’s technology companies are mature, with strong balance sheets, developed revenue streams, mature profit streams and significant geographic diversification. To illustrate this, consider Table 2.
MSCI INFORMATION TECHNOLOGY INDEX FUNDAMENTALS 2000 VS. 2020
SOURCE: BLOOMBERG DATA, CAM CALCULATIONS
The above table is based on the index constituents of the MSCI World Information Technology Index. The table uses various metrics to contrast listed companies in 2000 to those that appear in the index today. The table does this using three popular company valuation criteria: the price to book (P/B), price to sales (P/S) and the price to earnings (P/E) ratios. These ratios reflect the relation of an individual security’s share price relative to the prevailing book value (equity value) per share, revenue (sales) per share and earnings per share. The higher these numbers the more an investor is paying for one unit of each and is thus a gauge of how expensive stocks are.
The fourth metric is the free cash flow yield. This is a measure of the profits that a business is making. It indicates what cash is available to shareholders after capital expenditures as well as payments to debtholders. In its yield form, it is measured relative to the share price. Thus, the higher this number, the more free cash is available to shareholders per share. This is calculated for each company in the index to ascertain the 25th, 50th and 75th percentile, giving us an understanding of the spread in each statistic for 2020 versus the 2000 index.
To understand how different our current environment is, consider the 50th percentile (median) statistics for the P/B, P/S and P/E ratios for the year 2020. For both the P/B and P/E metrics the 2020 value is effectively half that of the 2000 index level while the P/S ratio is a fraction of the overall figure. This is primarily due to the fact that Dot.com bubble companies featured little in the way of earnings or underlying value to shareholders versus technology companies of today.
This is also evidenced in the 75th percentile statistics for 2020 companies which illustrates the lack of extreme valuations that were prevalent during the Dot.com bubble. From a different, but equally important perspective, the median free cash flow yield for Dot.com bubble technology companies was effectively zero. This means the average technology in the year 2000 provided no free-cash attributable to the underlying shareholder (either payable as dividends or maintained as retained earnings) after paying for its debt and capital spending needs. Contrast this to 2020 when even companies in the 25th percentile are free cash flow positive and able to return cash to shareholders.
Although investors often look at equities in isolation, it is crucial to understand the prevailing market environment when considering an investment in equities. In the year 2000 the US 10-year bond yield was 6% when the average technology company yielded nothing (as evidenced in table 2). In 2020 that same bond yield is 0.6% while the average technology company yields a 3.8% free cash yield. The distinction is important as it reveals the strength of technology companies to provide investors with a return in excess of what you could receive from a risk-free asset. This was not the case in 2000.
WHAT'S CHANGED?
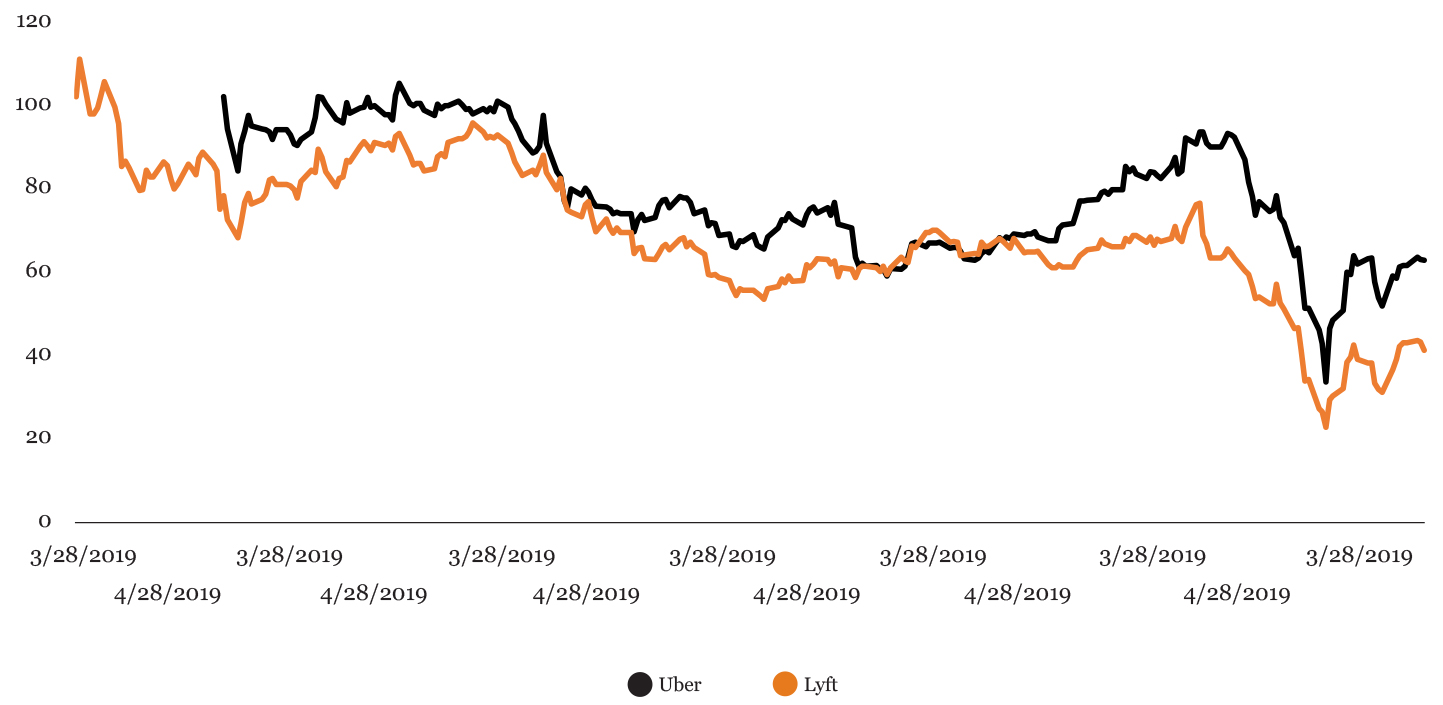
Twenty years ago we found ourselves in a very different time than we do today. The 1990s saw the development of the internet, email, and the rise of the technology segment of the market. The market was unaccustomed to the effect that these companies were having on our world. As such, a good story could fool swathes of market participants. This is no longer the case. Market participants have become adept at understanding the potential inherent in technology companies and thus companies are priced closer to their fair values. An example of this was the listing of both Uber and Lyft in 2019.
Both companies initially traded at lofty valuations while in the hands of private equity investors, who bid up in expectation of a momentous listing. Both companies were hailed as innovative powerhouses alongside companies like Airbnb and Booking.com for being able to provide a service without holding physical assets. Yet, since listing, both companies have lost approximately half their value as the market correctly assessed (amongst others) political and regulatory risk, demand in different regions, and the lack of pricing power given a client base that is fickle when it comes to pricing.
SHARE PRICE SINCE LISTING - UBER AND LYFT
SOURCE: BLOOMBERG DATA, CAM CALCULATIONS
Another fantastic example that had to forgo a listing was WeWork. Initially touted as being worth $47 billion, the company provided listing documentation for the market to better understand the technology real estate company. Very quickly WeWork was valued by market participants at a valuation of approximately $10 billion (and potentially less) as the market grappled with the fact that this is merely a short term leasing company renting office space in the short term while taking on the risk of significant long term rental contracts and refurbishment expenses.
However, based on the above, we shouldn’t assume that all technology companies get slammed in the listed environment. Companies like Microsoft, Amazon, Apple and Google are trading at (or near) trillion-dollar valuations because of how successful they have been at maturing, diversifying and providing returns to shareholders. These are the technology companies of the future and they are important because they feature prominently in our equity indices today.
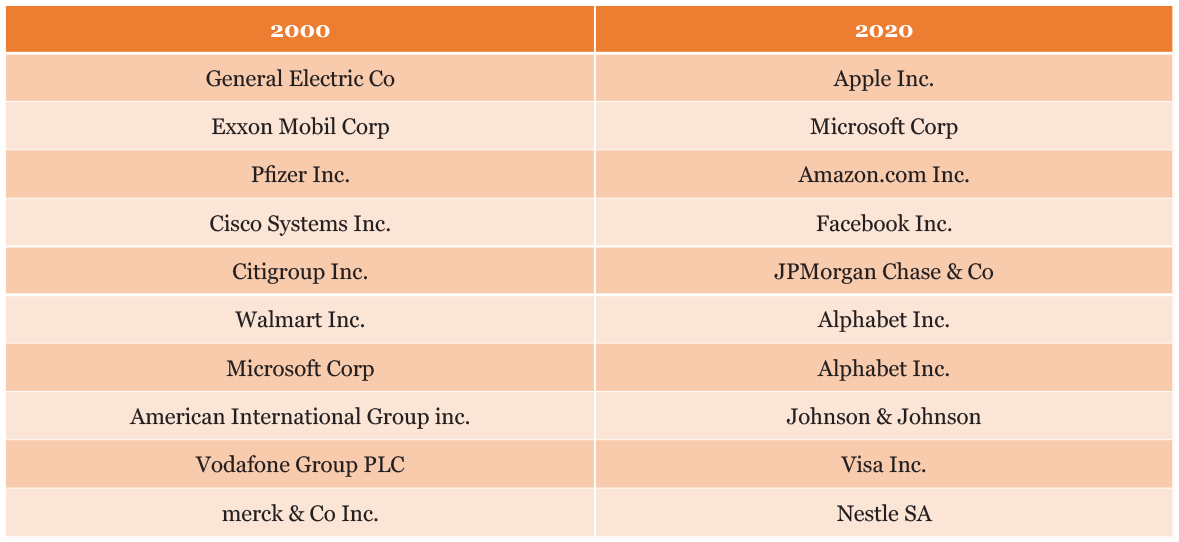
Consider the top 10 companies in the MSCI World Index (a collection of developed market companies) in 2000 versus today in table 3
LARGEST COMPANIES IN MSCI WORLD - 200 VS. 2020
SOURCE: BLOOMBERG DATA, CAM CALCULATIONS
One can see a considerable change from an eclectic group of companies from different industries in 2000 to one that is dominated by technology in 2020. In addition, there are a host of technology companies that are listing daily on various exchanges, so expect this trend to continue.
IN CONCLUSION
The year 2000 and the subsequent bursting of the Dot.com bubble was an important milestone for technology companies and investors. At that stage, the promise of computing was outweighed by its practical benefits. We mispriced a host of companies based on our lack of understanding.
Today, technology plays a much larger part of our lives and in the indices that we invest in. The development of the technology industry and where we find ourselves from an investment perspective has been healthy and orderly. What took us by surprise in 2000 is now being taken in our stride and the technology companies left standing are there because of the value that they provide to consumers and investors. Just as it should be. The emergence of technology is and will always be important. So we need to continue to be nimble and adept at valuing these companies.
At Citadel our equity team has been valuing global companies for years, so we understand the global environment, especially that of technology, extremely well.
What is ironic, is that many thought the next financial crisis would be based on technology valuations. But it is because of our technology companies that we are able to operate so fluidly in the midst of this viral catastrophe, further endearing these companies to us, both as global investors and consumers.
You’ll find that in this issue of Citation much has been said about COVID-19, as it should, but this piece looks at the investment landscape using a different lens. Nevertheless, post this crisis, we believe that technology will be even more important, but so too will be the need to understand these companies well, if we want to be able to allocate funds to the absolute winners. We believe that we have the tools in place to do just that.